As I continue to educate myself on real estate investing and the macroeconomic universe of which it is a part, I have found myself analyzing more and more data and combing through more charts. In this article I will share with you my favorite chart.
In a previous article The Power Of The Buy And Hold Model: A Team Of 5 All-Stars, I describe why I believe in investing in rental homes.
- Cash Flow
- Appreciation
- Tax Benefits/Tax Sheltered Income
- Mortgage Principal Paydown From Rent
- Inflation Hedge
While the numerous benefits are very attractive, of course nothing worth having comes without risk.
In talking with others interested in real estate investing, the question that almost always dominates the conversation is related to what has happened/will happen to property prices?.
While property prices are important, are they the most important metric? Are home price declines a big risk for buy and hold investors?
I bought my 1st rental property in 2004 and by 2008 it had gone down in value by 16%.
While no one likes when the value of their assets decrease, this situation taught me a valuable lesson and was one of the main catalysts for my decision to work at becoming a long term buy and hold rental home investor at scale.
The reality is, it didn’t matter that the value of my home went down. It didn’t matter because it had no effect on the income and expenses related to the asset. I was netting just as much monthly income as when the value was 16% higher.
Perhaps most investors are focused on home values because the stock market has conditioned them to think this way. For the most part, when you own a stock the share value is the only thing that matters (with dividend % potentially also in play).
Appreciation, while great when it happens, is just 1 of the benefits of owning rental homes. There are 4 additional ways to profit.
The real risks to the buy and hold model are vacancy and maintenance. Buying right and controlling these 2 risk factors is how you win.
The better question for people interested in real estate investing to ask is not, what will happen to home values? but, what will happen to rental rates?.
Said another way, can I predictably keep my property rented at the amount that helps me achieve my cash flow target?
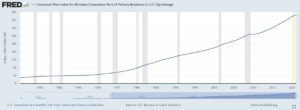
My favorite chart helps to provide insight into this. The below image shows average rents in the United States since 1950. It is a thing of beauty. 
Just look at that chart. Compare it to other economic charts such as the Dow Jones Industrial Average, The Federal Funds Rate or even the Case Shiller Home Price Index Chart over similar periods.
The other charts are extremely jagged. Our chart is ultra smooth.
Jagged = unpredictable volatility = stress. Smooth = predictable = peace of mind.
Of course just like with anything else, past performance is no guarantee of future results, and the pandemic did drive rents down significantly in a small number of high profile urban markets, but as the chart shows, rental rates have been extremely predictable.
When I first started owning investment properties, I had questions about whether there would be enough rental demand and if I could keep my units rented at my target amounts?
My experience as a buy and hold investor over the last 17 years mirrors the chart. Rents and occupancy have been very predictable with rents going up steadily over time with no declines.
The reward side of the equation for buy and hold investors is thick. With not 1, not 2, but 5 powerful benefits one would think that the model would be extremely risky. The reality is, when done right, the risks are relatively low. Rental homes are in high demand, people are highly motivated to pay their rent and rents rarely go down.


